

PPC, as one of the more measurable ways of digital marketing, provides a great platform for people to understand exactly how much they are going to spend. Within reason, and by utilising data, it gives them an understanding of the type of return they can expect, as well as any growth opportunities. This makes it highly appealing to people who are looking for a directly measurable approach
As someone who studied Specialist Mathematics, I’m not afraid of some number crunching, or longer more complicated equations. However, after ploughing through endless spreadsheets I was convinced there must have been an easier way to do this – enter Google Data Studio. Now don’t get me wrong, there’s still quite a bit of maths involved here, but, the data visualisation beauty of Google Data Studio means that trying to explain it to clients just became a whole lot easier. By combining the equations & letting Google do the working out for you, you can not only leverage the data that’s available, you can also present it in a way which is pleasing to all key stakeholders.
Now I’m aware there are many different ways to do this & there are also a number of tools within the market that do this for you. So, today I will share with you how I approach PPC forecasting when it comes to growth &, also, starting to understand the type of return you can expect on both ad spend and leads when launching campaigns.
I want to caveat that there are two different ways to tackle this & today I will only be looking at growth forecasting – that is forecasting when you have pre-existing data that you can work with. If you are looking to forecast from scratch then that is a whole different ballgame (& a whole different blog)! For the purpose of today we will be focusing on utilising data that you already have to predict growth.
Forecasting – Search Growth
If you have an existing Search Campaign & you’re looking to grow your business & drive new leads, chances are that you will have undertaken some growth forecasting. This can come in a number of different formats, from Google’s own tools, Excel spreadsheets or through in-house technologies. For the example below I’m going to show you how we can do that with Google Data Studio (with the help of Google’s “Opportunity Lost” template).
You can download Google’s “Opportunity Lost” template within the Data Studio templates &, once you have it, you will see that it’s a 13 slide template enabling you to see where the opportunity is within your Google Search & Display campaigns. (Note: I haven’t yet found one for Shopping but I am in the process of looking to create one).
For the purpose of this blog we are going to be focusing on Slide 3 (Search Bid Lost Overview) & Slide 5 (Display Bid Lost Overview). Let’s start with Slide 3 (Search Bid Lost Overview).
When you first load up the presentation it will look something like this:
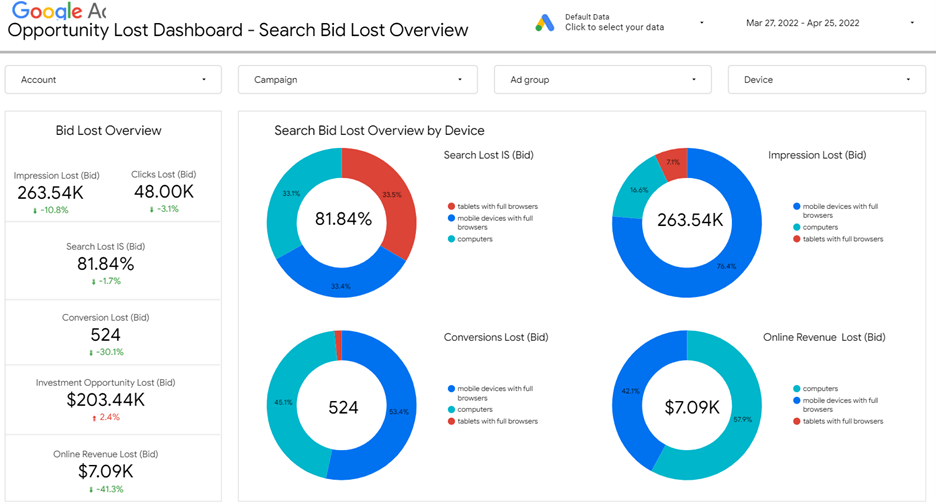
Now, while this dashboard in itself is incredibly useful & contains a lot of valuable information, when it came to forecasting I wanted to neaten it up to make for a more digestible board, which I could quickly & easily pull out in client presentations. Also, in the example below, as the client didn’t have an Ecommerce arm I removed all reference to Revenue, preferring to focus on the three main areas:
- Impressions Lost
- Impression Share Lost
- Conversions Lost
By focusing on the above I was able to simplify the dashboard & also tailor it so that I could break it down by different dimensions, including “Day Of The Week” & “Device” to help with my optimisations.
So, after a little work I adapted the Data Studio to look like the below (please note I’ve removed the client data hence the white gaps):
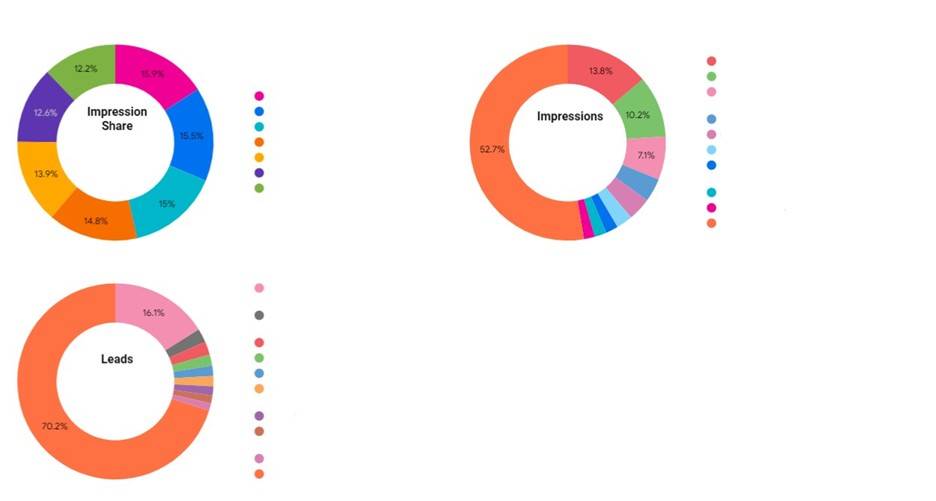
The beauty of this style of diagram is that not only does it give us absolute figures (in the middle) where we can understand what that growth looks like, it also allows us to segment by a dimension to help us identify where the real growth comes from. In the example above I segmented the Impression Share column by “Day Of The Week” so I could understand on which days I needed to bid more & in the Impressions & Leads columns I segmented by “Campaign” so I could understand which Campaigns had the biggest room to grow & improve. You can also segment by Device & other dimensions to really understand where your opportunity is & to drive the growth in the most efficient manner.
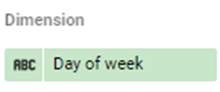
To do the above you simply need to change the “Dimension” section of the Google Data Studio report to “Day of week” or “Campaign” or “Device” depending on what you are trying to analyse.
Now, in terms of the calculations from Google’s perspective these are already input into the Data Studio, but for an understanding of how we can change these to suit different dimensions I’ve listed them here:
For Impression Share – Search Lost IS (Rank)
For Impressions – Impressions / Search Impr. share * Search Lost IS (rank)
For Leads – ((Impressions / Search Impr. share * Search Lost IS (rank))* CTR) * (Conversions / Clicks)
By using the three equations above we are able to use simple metrics within the account to estimate growth capabilities based on key data such as Conversions etc… As you can see from the top sheet you then have the option to choose between specific campaigns, and drilling down on the details here will get a better analysis of the campaign.
Changing Between Impression Share, Top Impression Share & Abs. Top Impression Share
Now in some situations you may just want to know the Impression Share that is available to you & how much your clients can grow, but in others you may want to know what more is available to you. That’s where editing the equations to incorporate Top Impression Share & Abs comes in. Top Impression Share can really help.
Let’s take a look at the equation for Leads:
If we change: ((Impressions / Search Impr. share * Search Lost IS (rank)) * CTR) * (Conversions / Clicks)
To: ((Impressions / Search Impr. share * Search Lost Top IS (rank)) * CTR) * (Conversions / Clicks)
We are now forecasting the potential if each ad is in the top positions (i.e. above the Organic search rankings), as opposed to if the ad just has the opportunity to show 100% of the time. By doing this we are able to identify not only visibility growth, but also growth patterns for higher ad positions & also top ad positions using Search Abs. Top IS (rank).
By utilising the above approach you can get a good understanding of how your Search campaigns are currently performing & where the potential growth areas might be. This is a great way to plan your upcoming campaigns.
Forecasting – Display Growth
Now that we’ve looked at how to forecast Search growth, we can roll out the same principle to forecast Display growth – although generally with much bigger metrics. I’ve created a similar dashboard here for Display, which you can view below, & focused solely on any campaigns which sit on the Display Network. What’s most interesting to note here is that dimensions such as “Day of the week” & “Device” are more pronounced. This is a much easier way to digest & get that data than trying to source it manually.
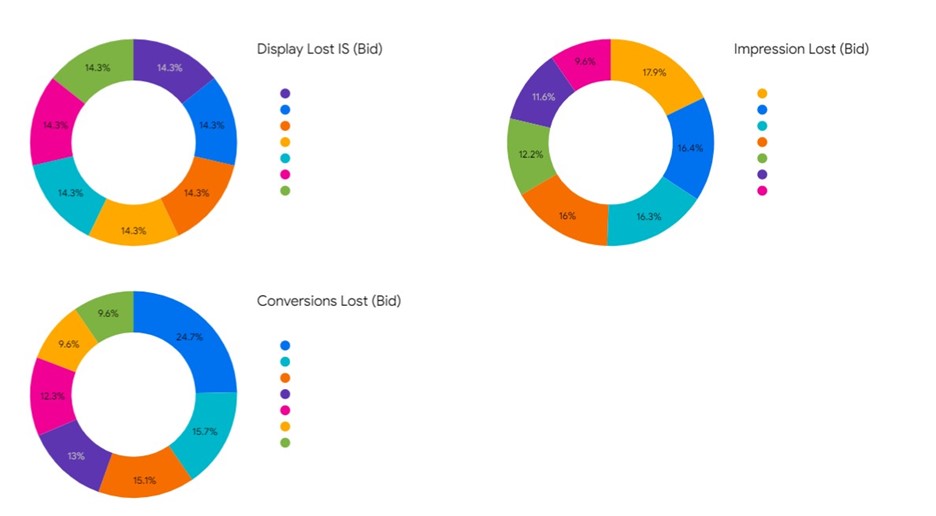
The dashboard above works in exactly the same way as the Search dashboard, except that it displays content related only to the Display campaigns. The equations work in a similar manner other than they use Display Lost IS as opposed to the search variation. All in all it’s a great way to see the overall performance of the Display Campaign & identify any areas of opportunity.
Conclusion
If you’re looking for a way to effectively forecast then there are a whole host of tools out there that you can use. However, if you are looking for a quick way to utilise the power of Google Data Studio for PPC forecasting then the ideas above should help you on your journey to find out the PPC potential of your campaigns & your website!