

We all know that Digital PR plays an important role in any solid SEO strategy. Whether it’s chasing after valuable high-quality links, improving the external reputation of your business, or trying to build credible, expertise-driven connections between your website and other trusted sources, doing it in a sustainable and consistent way is a key pillar of SEO success.
Although there are many ways to do Digital PR effectively (think newsjacking, thought leadership, product placements), data-led campaigns have grown in popularity as journalists look for interesting, data-driven stories to entertain their audience.
When data-led campaigns started a lot of them were based around surveys. In some cases, these were expensive to commission (upwards of £3,000 per survey) and it took a while to get the data back. Although these are still a popular option among many SEO agencies, the rise of freely available data sources has paved the way for cheaper and quicker turnaround pieces, for example newsjacking with a data-led campaign. Yet they are also equally as effective for targeted news stories, thus creating a great recipe for effective Digital PR. This has led to a big rise in smaller data-led campaigns, which are a favourite among many agencies, including the team here at Cedarwood.
To help out on your hunt for free data we’ve collated some of the best free data resources available to Digital PR professionals right now. All you need to do is go in and grab your data, find an angle and perfect that pitch. Data-driven Digital PR campaigns are a great way to enhance those all important E-A-T signals, adding real value to your SEO campaigns. So what are you waiting for? Get started by having a read through our list below:
1. Statista
One of the biggest portals of available data, Statista holds data from over 170 industries across 150+ countries so, if you’re looking for data, this is a great place to start. With a super easy to use interface you just input your search query to find relevant results. For example, if I wanted to know more about the 2022 FIFA World Cup I could input that exact query:
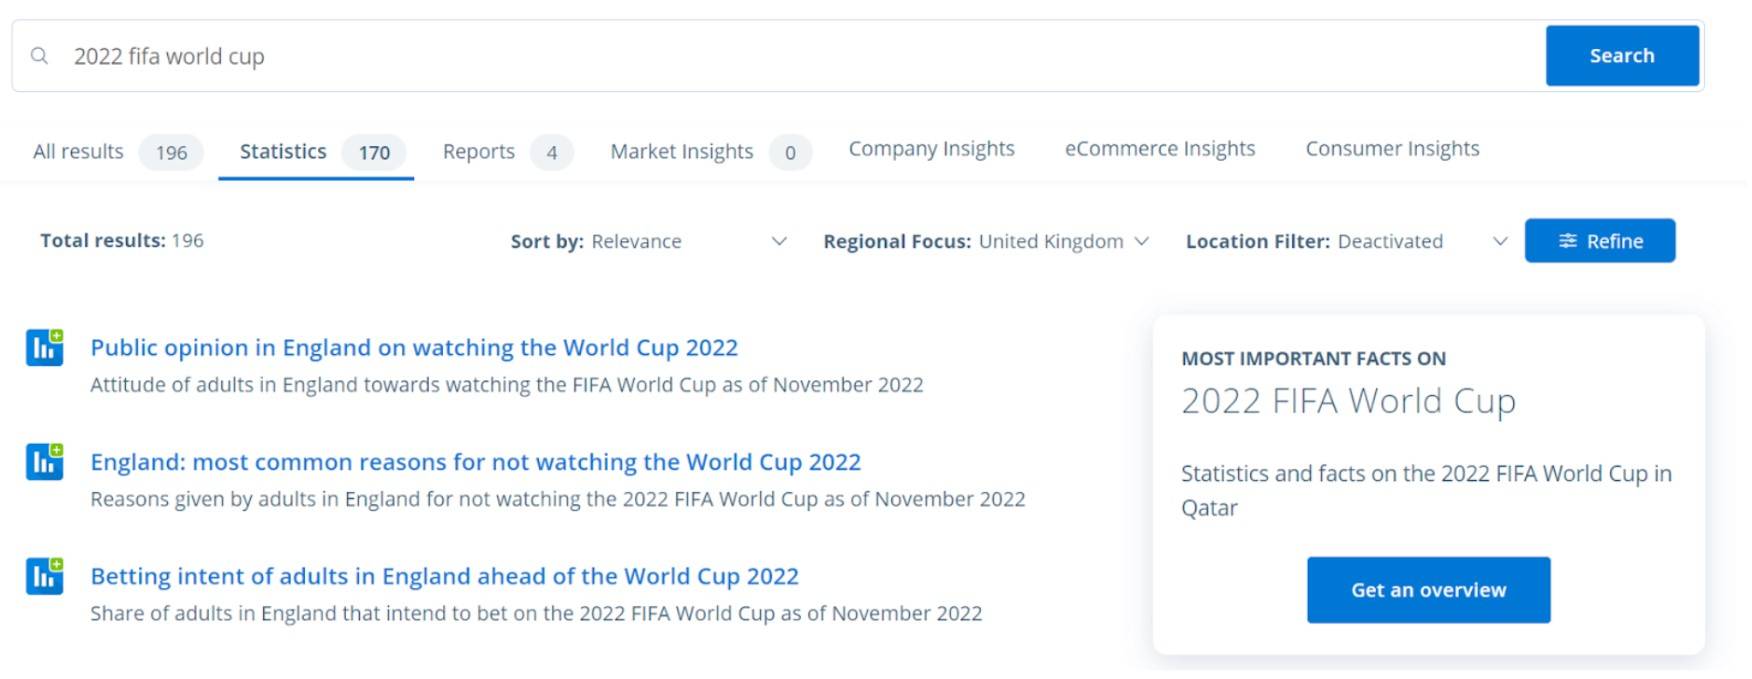
Source: Statista
If I wanted more of a summary, I have the option to only select the most important facts, for example, the transfer value of each of the country’s teams in the World Cup. I could then drill down further:
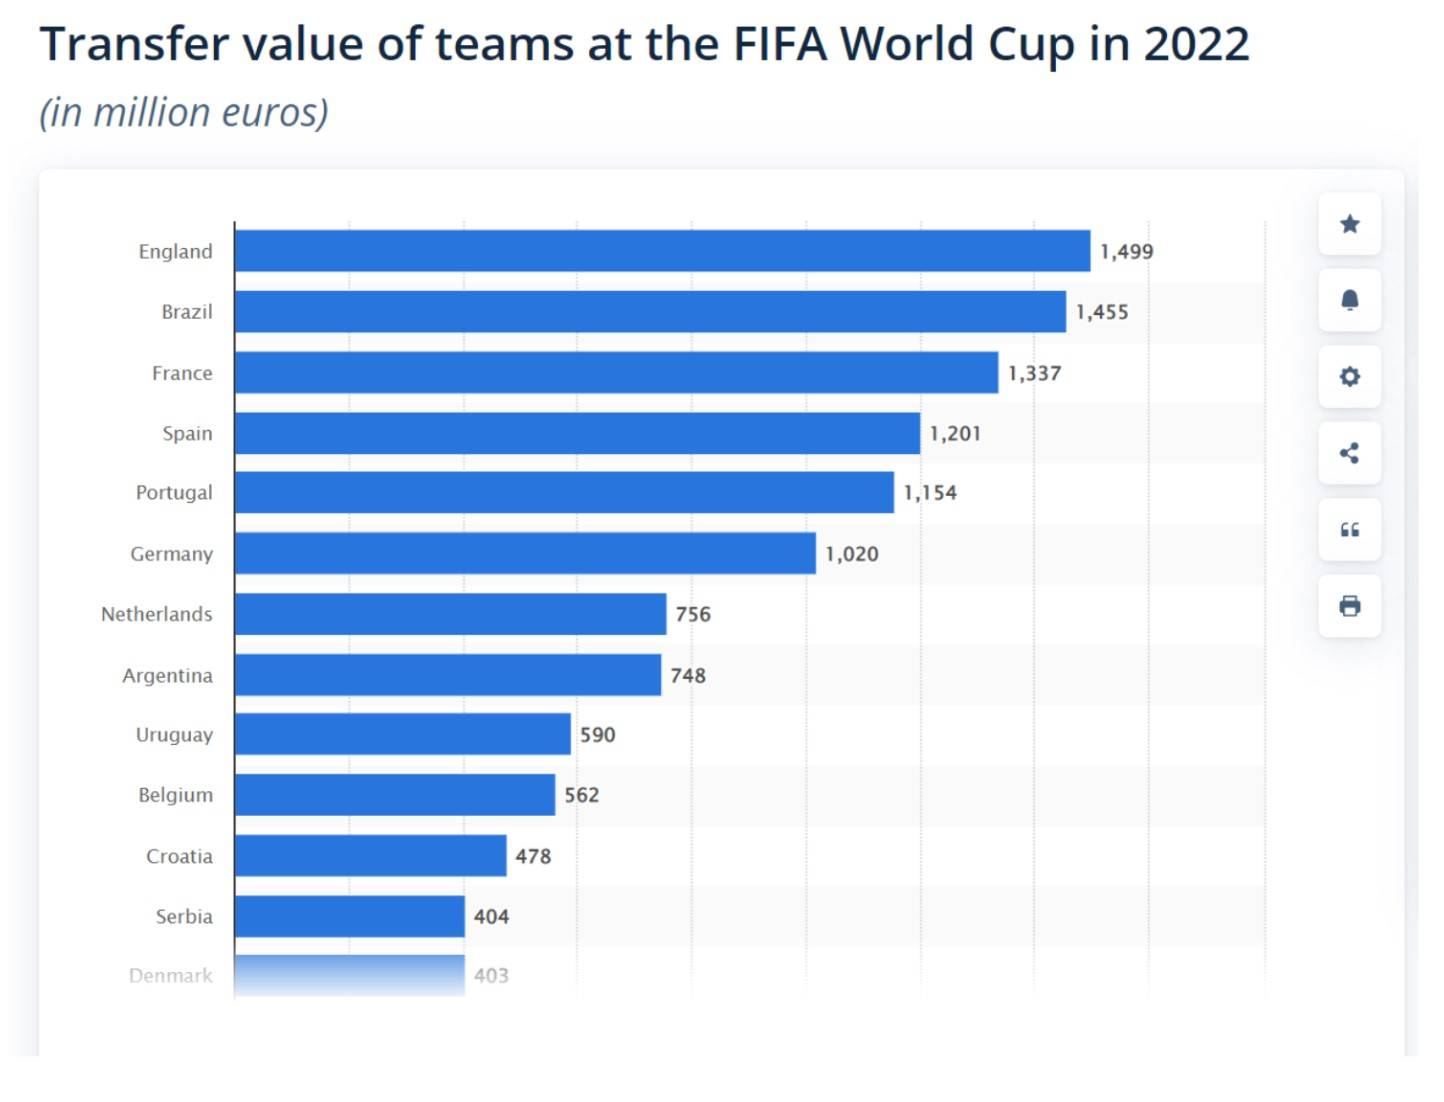
Source: Statista
Utilising data like this is a really valuable way to quickly analyse and pull together a newsworthy story. An example of the above would be looking at how likely a team is to win the World Cup based on their transfer value – a very timely, topical and data-driven piece of content from a very effective free data platform.
2. Google Ads Keyword Planner
https://ads.google.com/intl/en_uk/home/tools/keyword-planner/
Google Ads Keyword Planner is a highly effective way of gathering data around key trending topics and search volumes, to draw an analysis piece. The tool allows you to view current data (up to the previous month), data for related searches and even historical data for a few years, allowing you to analyse year on year comparisons.
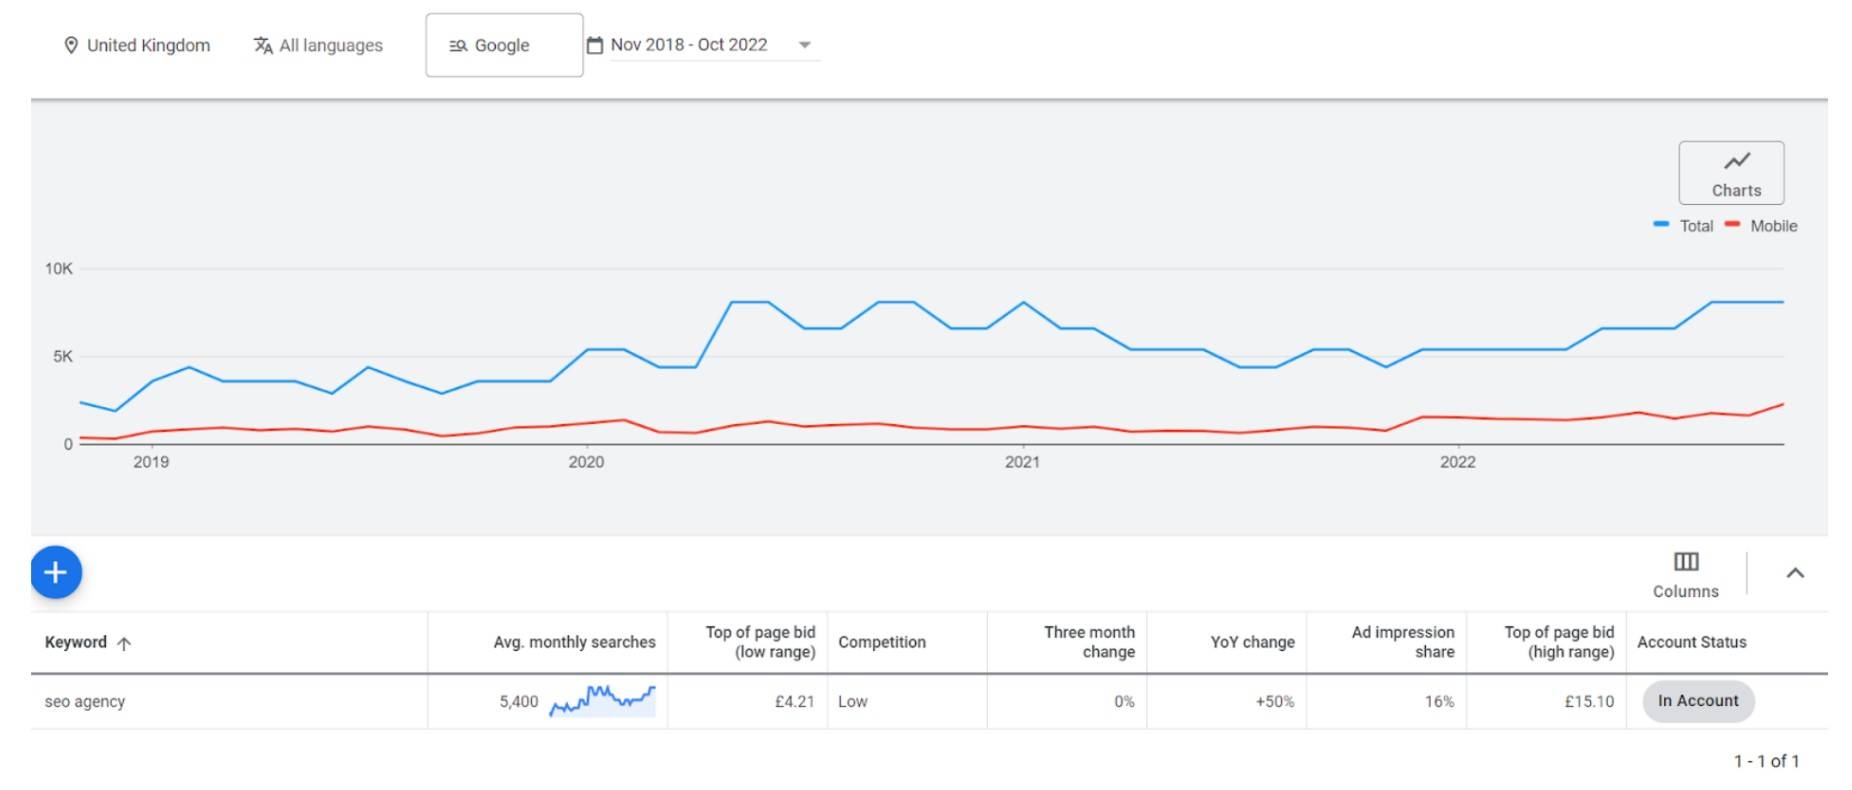
Source: Google Ads Keyword Planner
In the above image we can see the variety of information that Google Ads Keyword Planner makes available to us, including search volume per month for that keyword, level of competition, change YOY etc… We’re also able to split that out by device (mobile or desktop), and drill down by a specific country, region or even city, enabling us to make comparisons at a very granular level. With this level of detail freely available, you can probably already imagine the types of angles and stories that can be developed just from accessing this data.
We recently used data in this way to pull together an effective Digital PR campaign for our client, Mist E Liquid, looking at which date users would give up their new year’s resolutions (based on search data). This landed some great coverage including a link from Yahoo!. If you are looking for a great option for data analysis then the Google Ads Keyword Planner is a good place to start.
3. Google Trends
https://trends.google.com/trends/
Google Trends is another great tool that Google offers that provides you with the option to undertake free data analysis around trending topics. You can analyse something that is incredibly topical and compare it over time, by location and against other trending topics, to once again draw conclusions for an effective digital PR piece.
Google Trends allows you to analyse the performance of particular trending topics over time, as well as compared to one another:
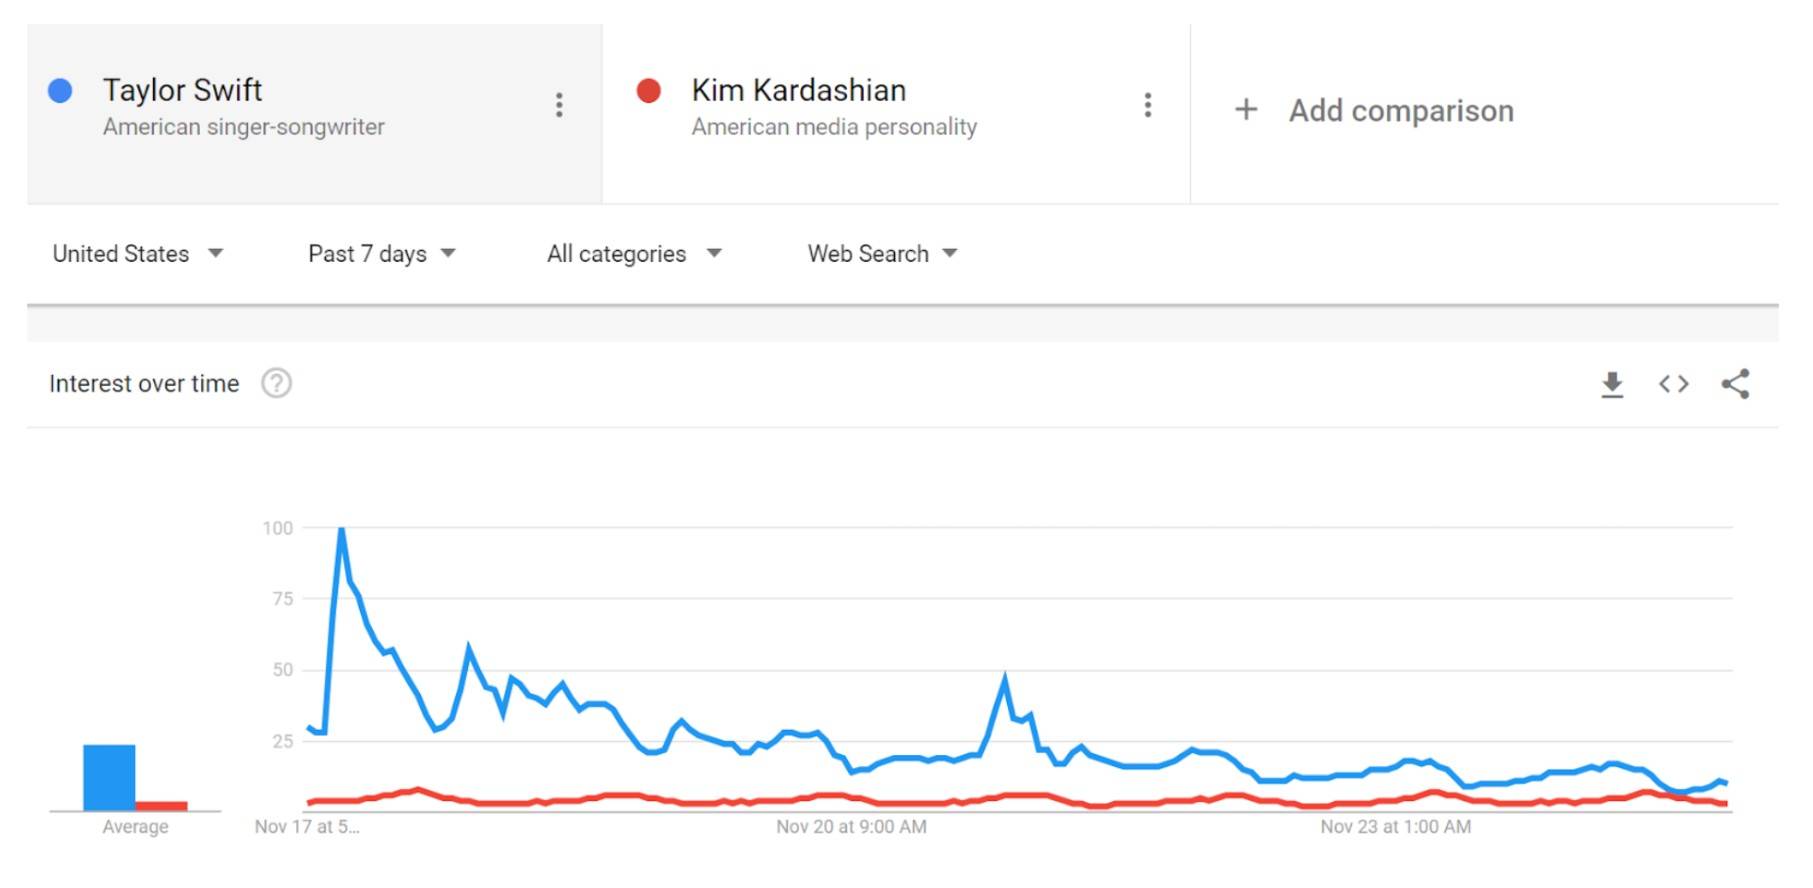
Source: Google Trends
In addition, it has a drill down option where you can compare the performance of those trending topics in specific areas; for example, looking at how trends for Taylor Swift and Kim Kardashian differ based on US States:
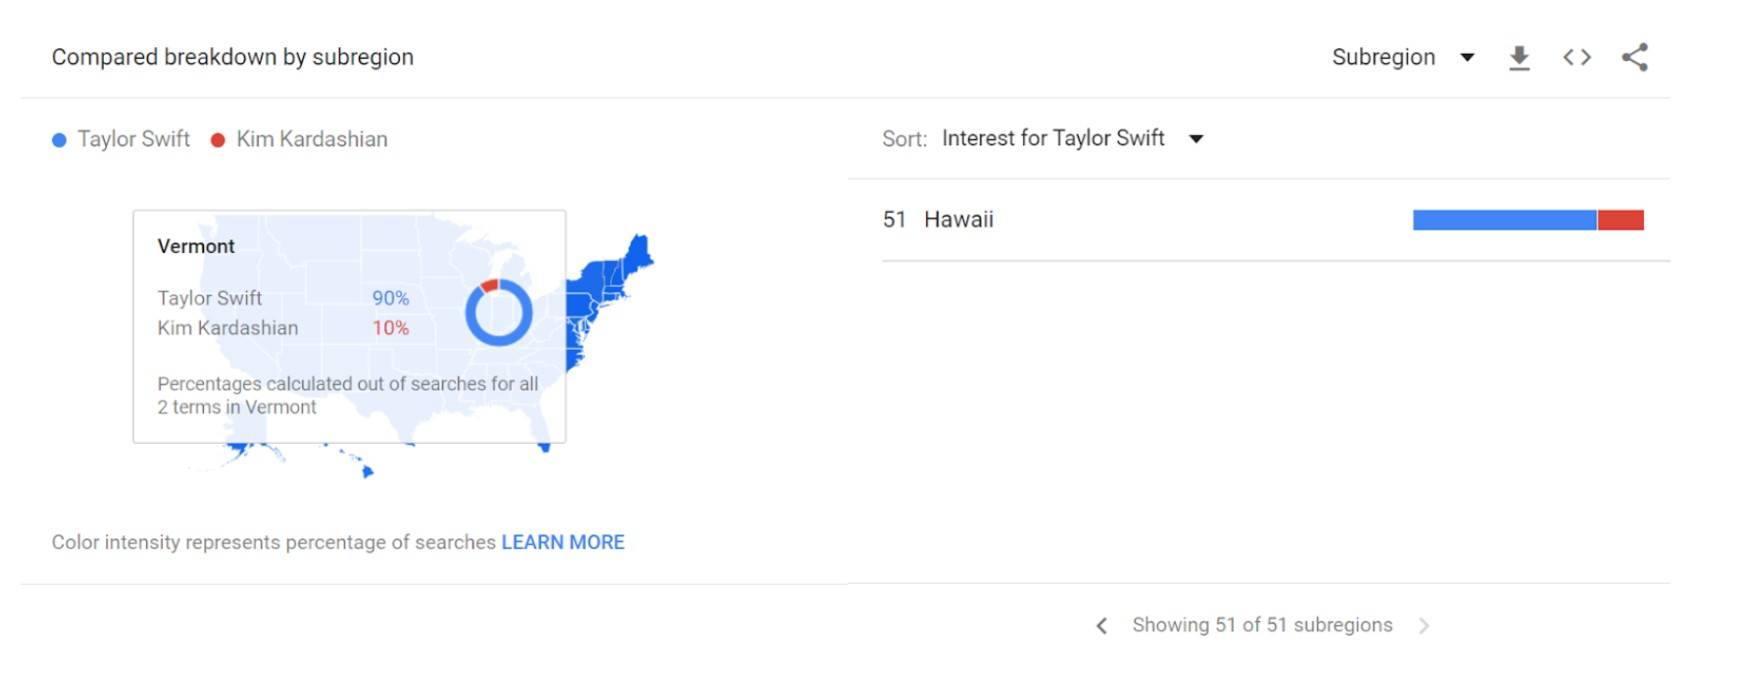
Source: Google Trends
Similar to the Google Ads Keyword Planner, Google Trends can be quite granular with its dataset, so it’s down to you to understand which data you are looking for and how you want to evaluate it. If you are looking for up-to-date data on topics that are currently trending, or even just for ideas on which topics are actually trending, then this is a great place to start.
4. NHS Digital
NHS Digital is an online platform where you can freely access data that the NHS holds, and reports that they frequently publish online. The data they cover ranges from statistics on NHS Stop Smoking Services to workforce statistics, maternity services, GP appointments and so on and so forth. It can be used as a data source for news stories closely relevant to the medical and technology sectors.
The reports are easily digestible and come with two main formats. Initially they give an overview of the key findings from the report, highlighting key pieces of analysis and themes that have come out of it; these are usually broken down into three or four boxes similar to this:
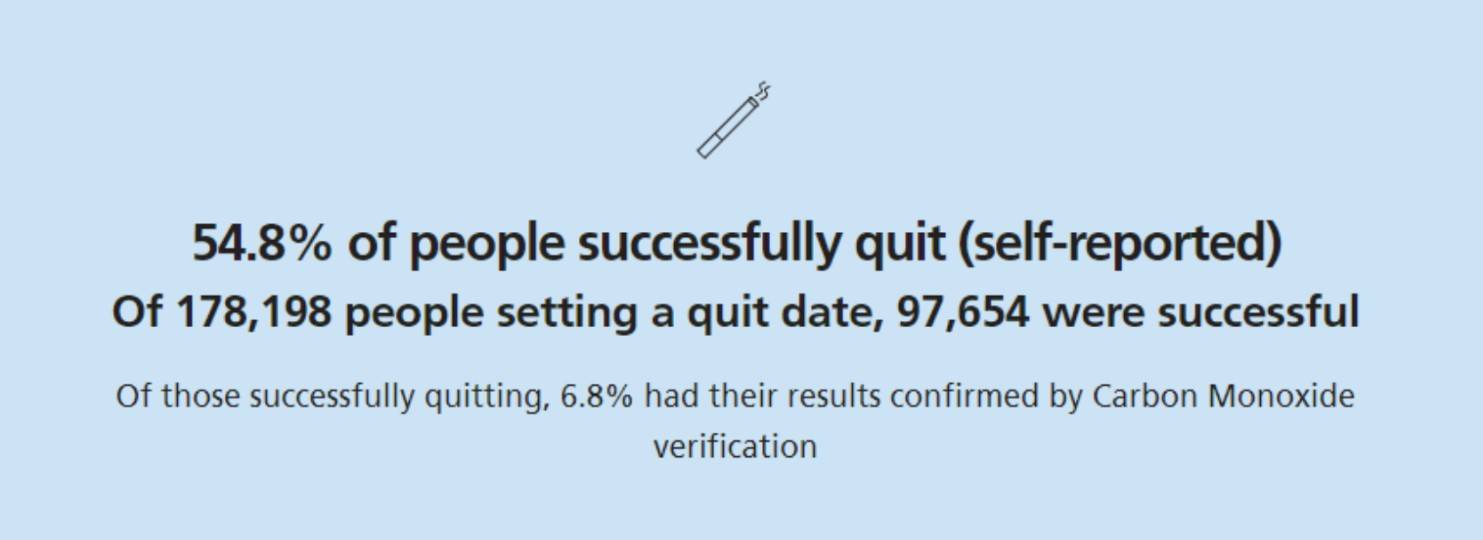
Source: NHS Digital
Following on from the headlines you then have a range of datasets which are broken down into both charts and Excel spreadsheets, to easily digest and manipulate/evaluate the data. This is where you can start to draw comparisons and identify angles which may be newsworthy or relevant for your client.
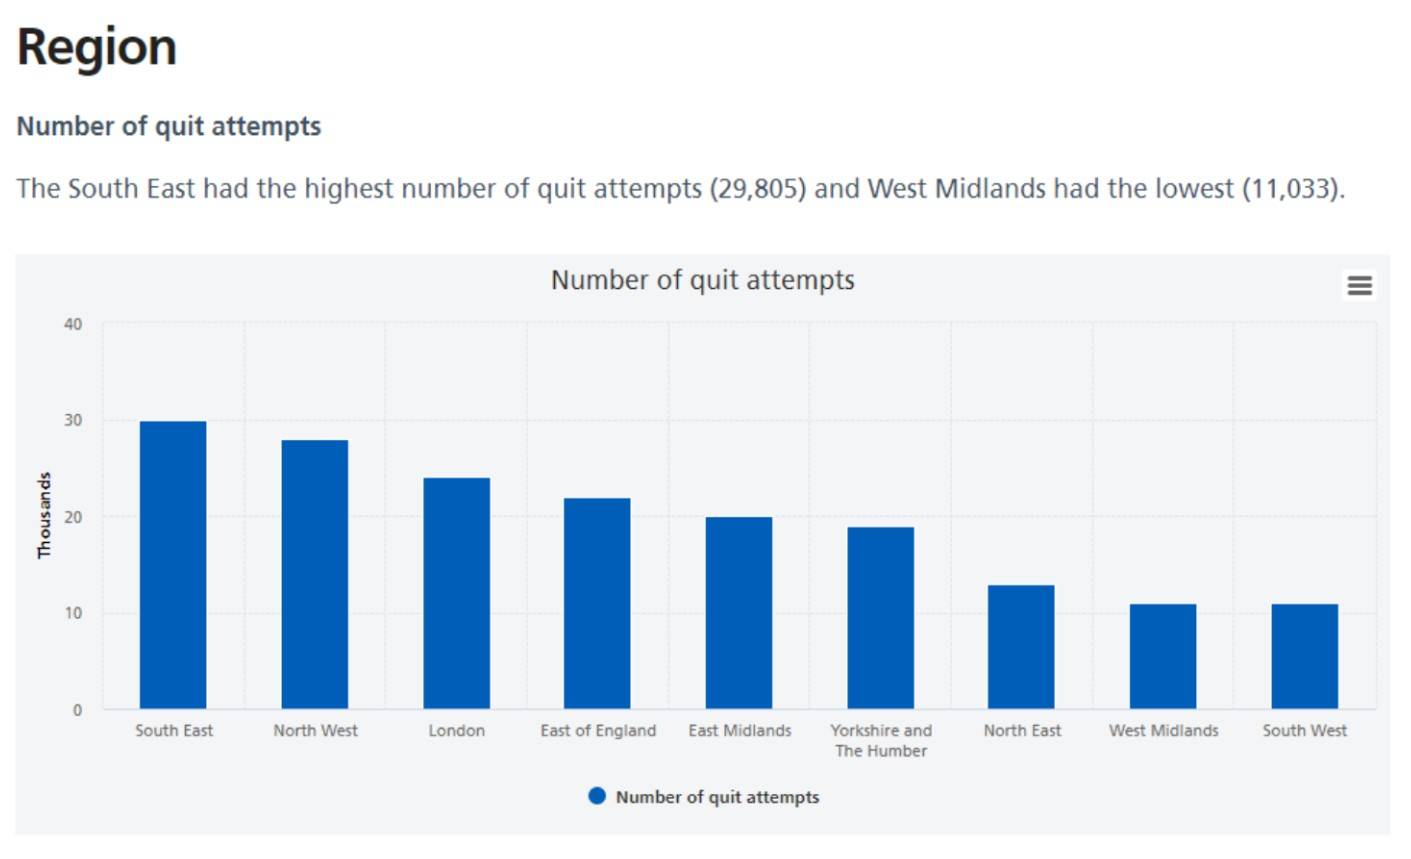
Source: NHS Digital
The data above allows you to draw topical analysis around the report, i.e. in this instance you could look to compare how many people have tried to quit smoking in a specific region vs the population of that region to understand which region of the UK is most likely to quit smoking. It’s a quick and simple piece of analysis that could be seeded to regional media with a local interest.
NHS data is often very topical and trending. A great example of this is how the recent NHS report into appointments in general practice (October 2022) was picked up and turned into a news story on The Daily Mail. The piece highlighted which of the country’s NHS practices had the least in-person GP appointments as per the report. It was, and still is, a very topical issue that has gained great coverage, and is a good example of how a free data report from NHS Digital can be turned into a successful Digital PR piece.
5. Office Of National Statistics
The ONS or the Office For National Statistics is another hub of free information. You can access a range of data sources, from employment rates and inflation (very topical at the moment!), to GDP and population/census data. In addition to standard reports it also offers several interactive features, such as interactive maps, graphs and diagrams of the economy, and indexes that cover areas like health.
On diving deeper into the websites you can see an extensive level of reporting on each of the aforementioned areas, with graphs and statistics updated on a regular basis.
Within each section you will benefit from an initial summary which governs the top level figures of each report and summarises them into a neat table. This is often complemented by a short dot point summary that outlines the key takeaways.
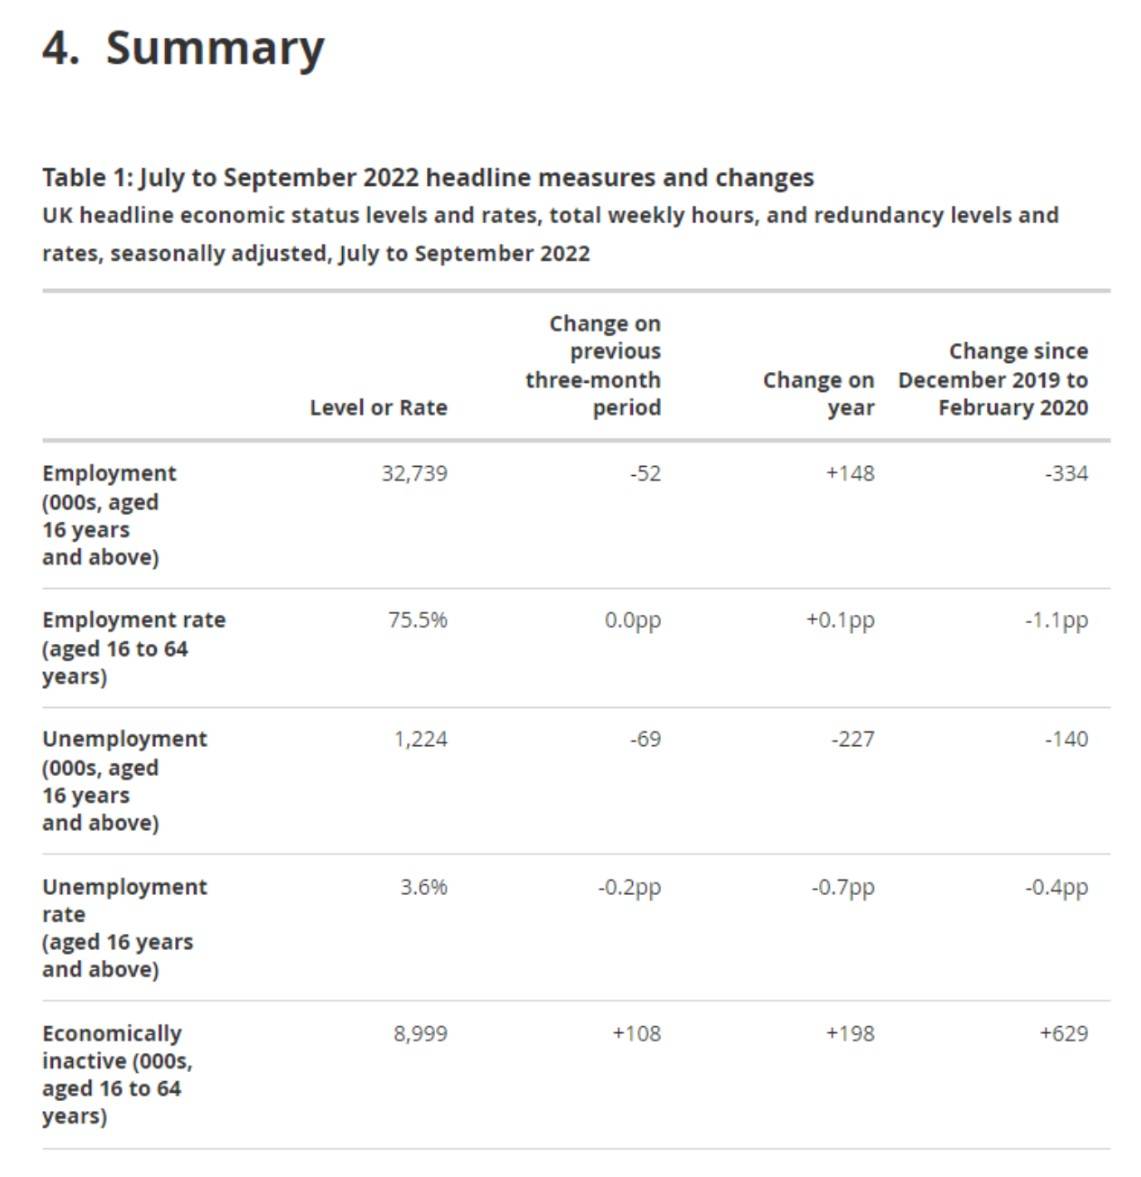
Source: ONS
Some more in-depth graphs usually follow, which evaluate both the three month change and trends over time, so that you can quickly and easily draw data analysis and conclusions.
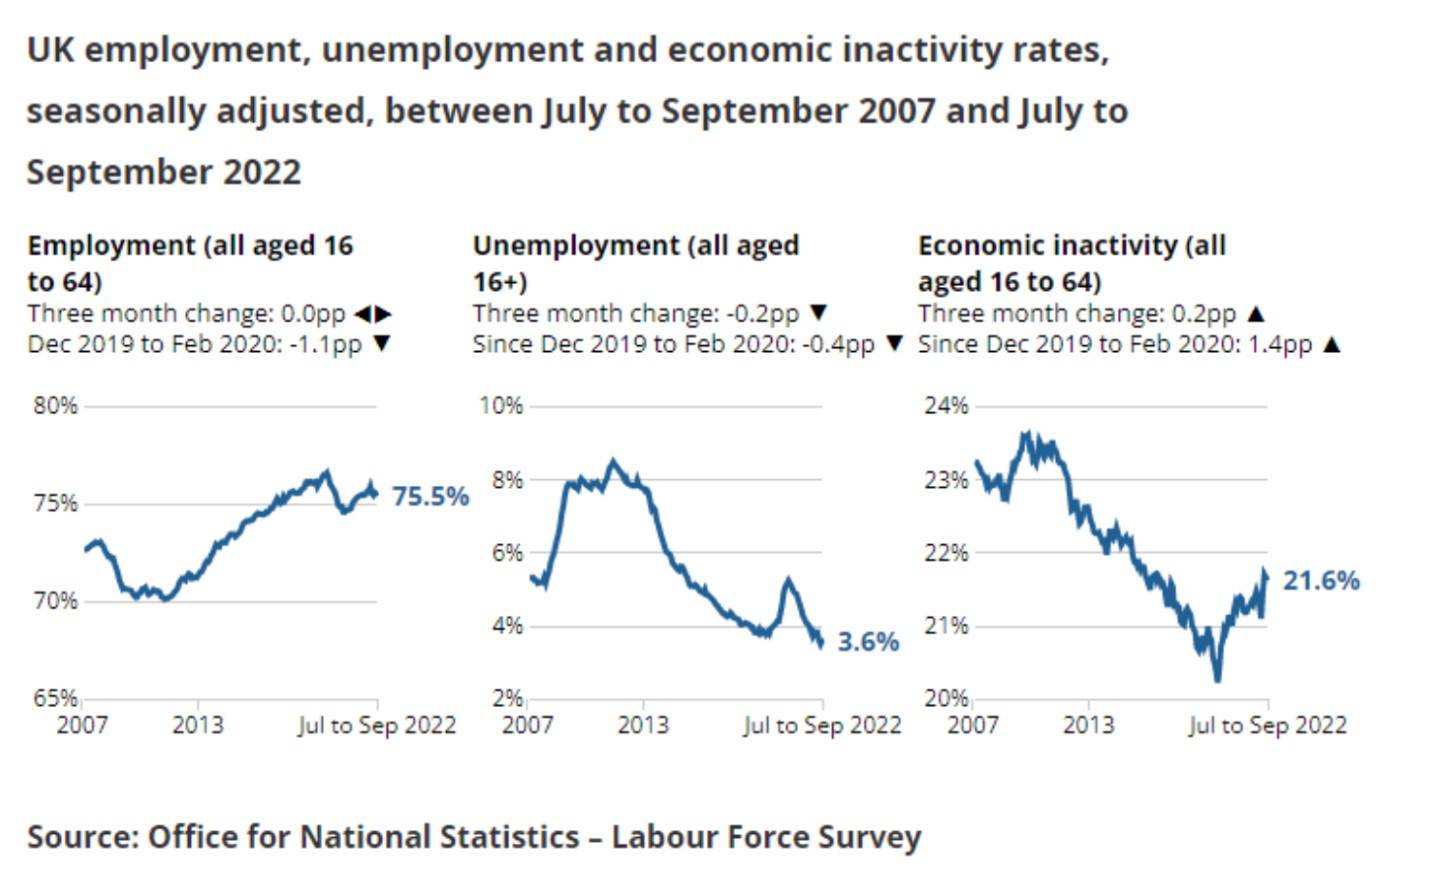
Source: ONS
The ONS publishes a wide range of reports on a regular basis, so it’s always worth keeping on top of any new reports that are coming up. They also have a huge ‘Time Series’ section, which archives any reports that have previously been created; doing a search here (with over 55,000 reports) is likely to bring up something relevant to your query.
Additionally, the ONS has a release calendar where they feature already published releases and list any upcoming releases. This allows you to plan ahead and check if there are any reports coming up that are relevant to you. You can therefore set some time in your schedule to evaluate and create a great Digital PR story from said reports.
Centre For Cities
https://www.centreforcities.org
Centre For Cities is a website dedicated to providing a range of data sources broken down by cities and towns across the UK. It’s great if you are looking for data about a specific region or are going for a local angle for a piece of coverage.
The website is incredibly user friendly and interactive. It features data in a number of different ways, including dashboard information that allows you to see a summary overview of how different towns and cities fare on key topics, such as energy bills and cost of living:
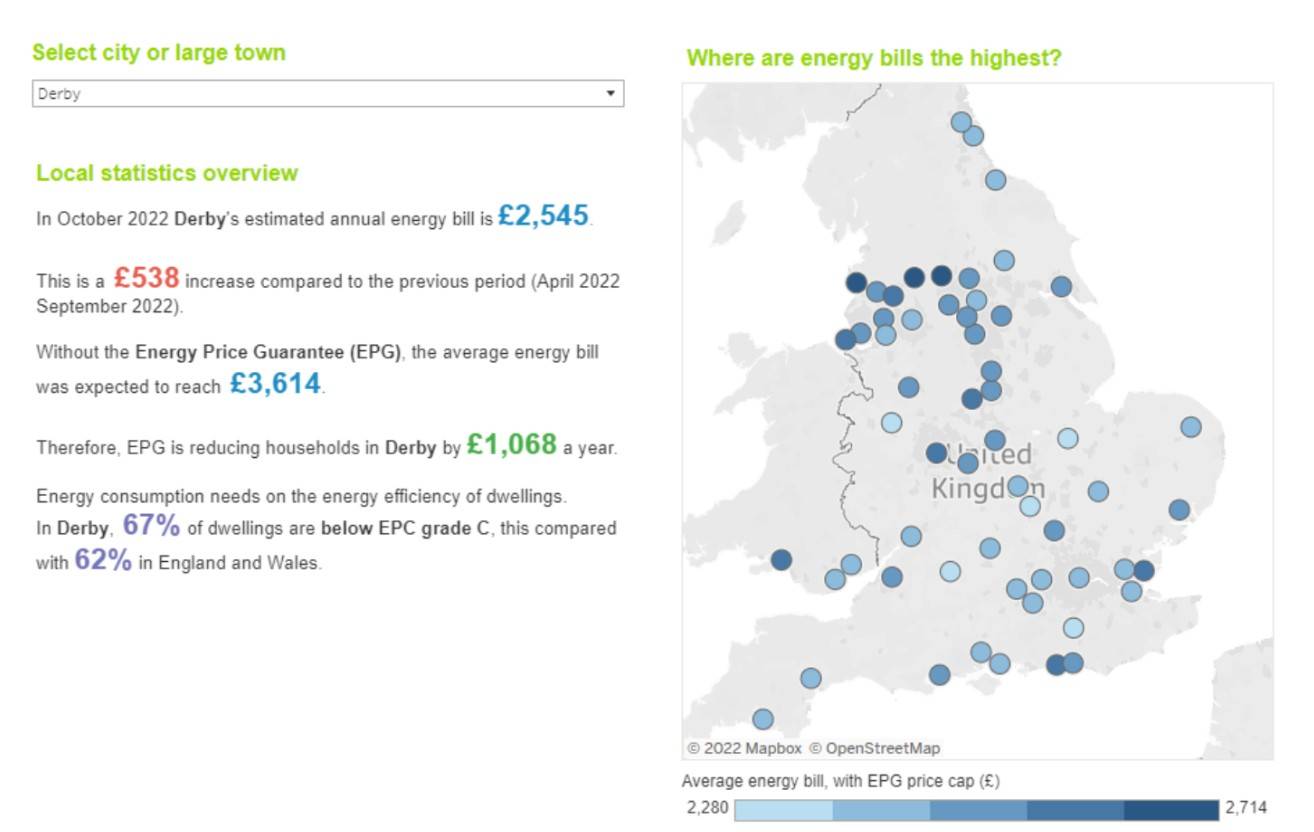
Source: Centre For Cities
There is also the option to break down this information in more detail, giving facts and figures to back up the data and looking at it in a more granular format:
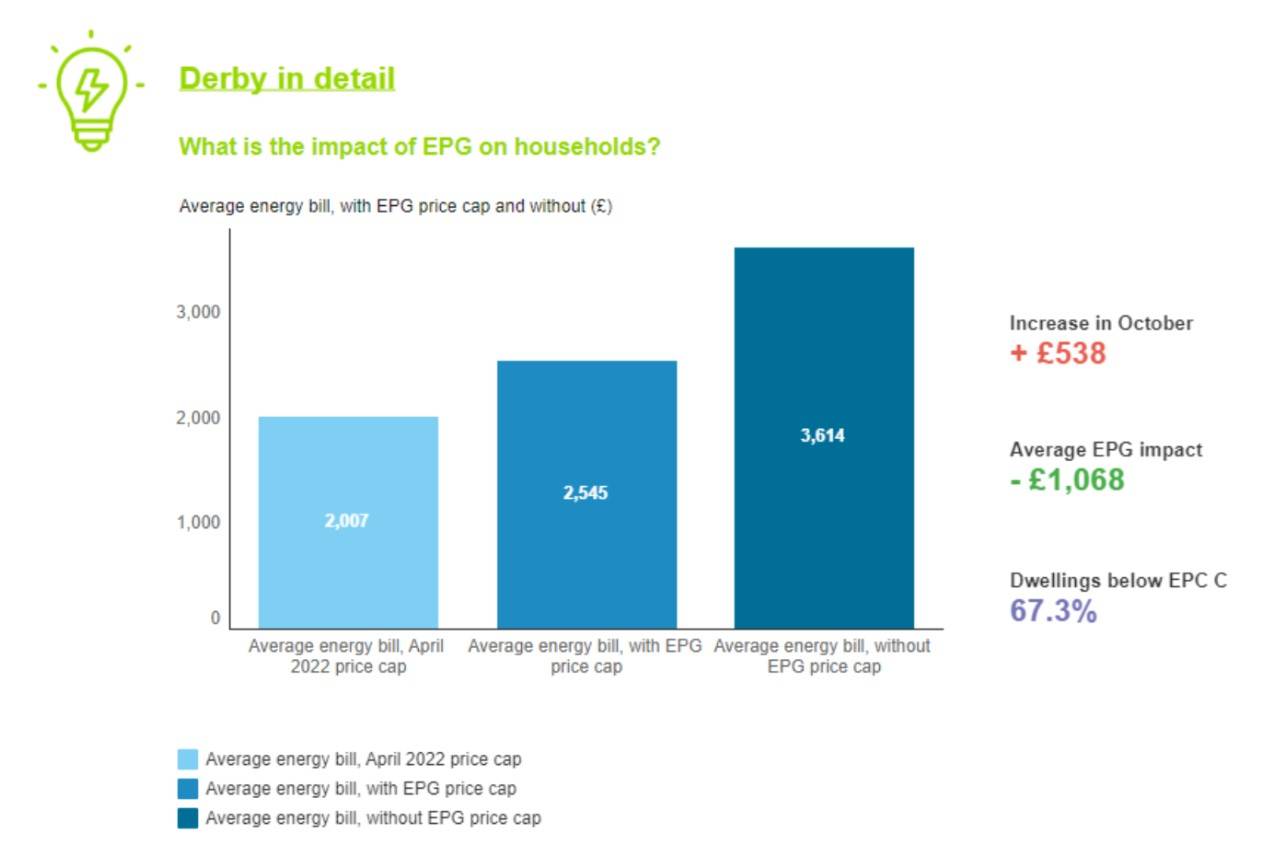
Source: Centre For Cities
The site allows you to draw direct comparisons between different towns and cities so you can see how they are performing alongside each other:
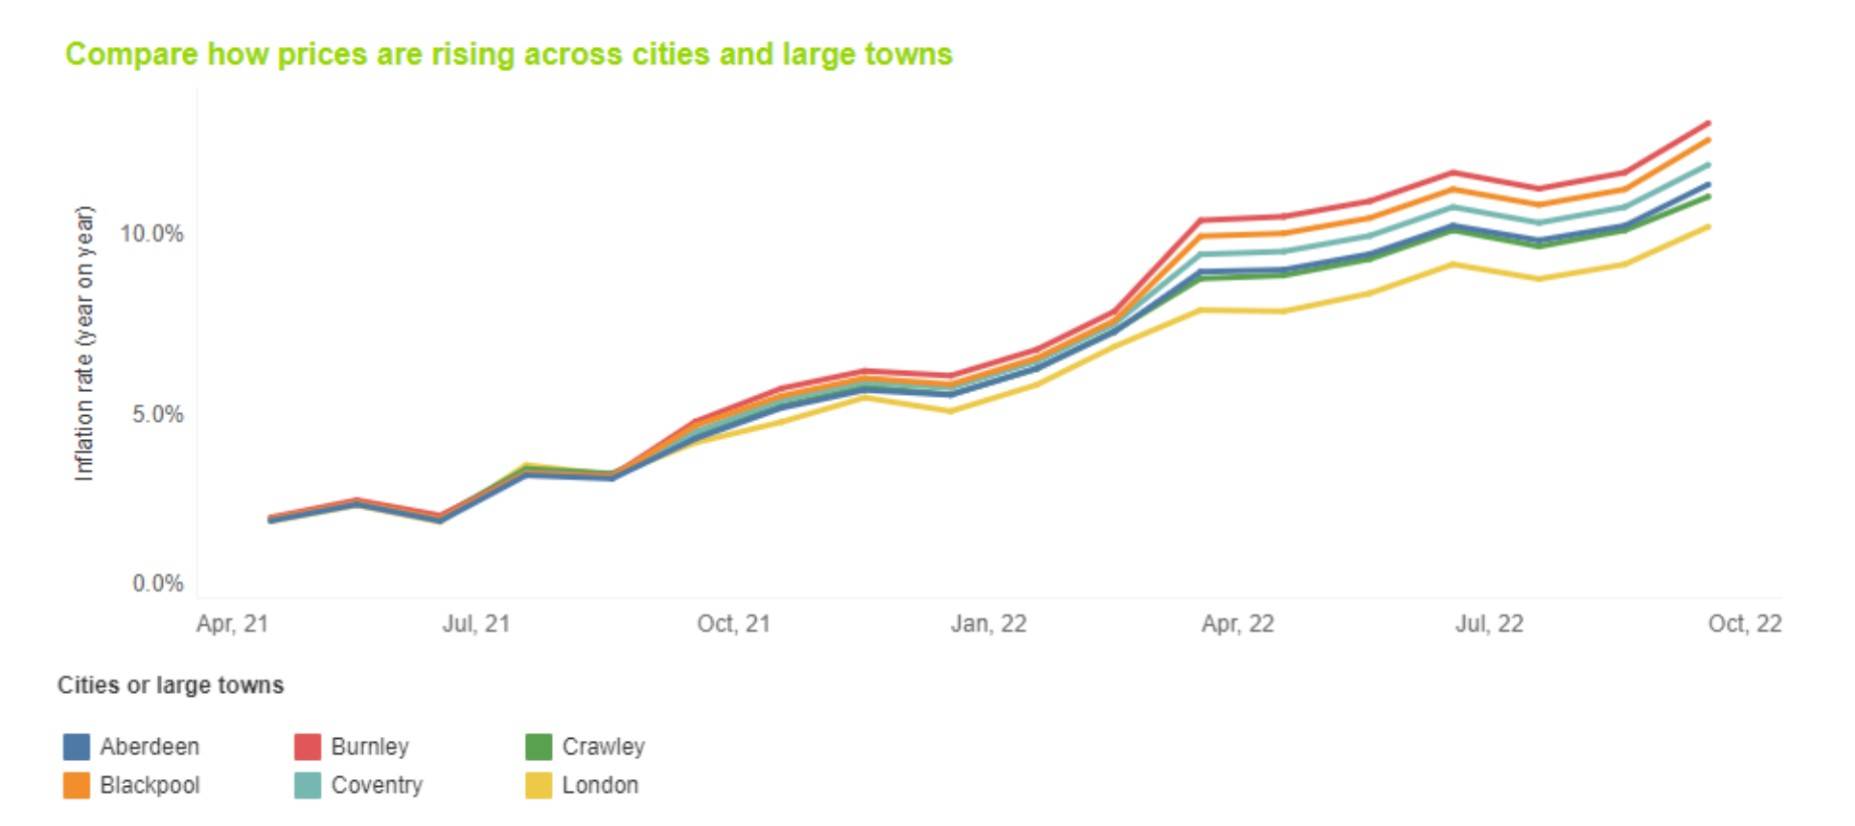
Source: Centre For Cities
This data can be especially valuable if you are looking to evaluate something in a particular town or city, or regionally. The clear visualisation boards can help with data analysis too, so if you are looking to source data on a regional level this is a great place to start.
Google Public Data Sets
https://google.com/publicdata/directory
Google Public Data Sets are publicly available data boards that contain a broad range of information from around the world. Information included in these datasets can be GDP, Word Development Indicators, Agriculture, Domestic Government, Education, Energy, Health, Infrastructure and so much more…
The interactive data sets allow you to evaluate growth over time and even helps to predict growth factors into the future. In addition, you are able to add and remove countries as you need which allows you to compare countries against each other – another valuable comparison metric.
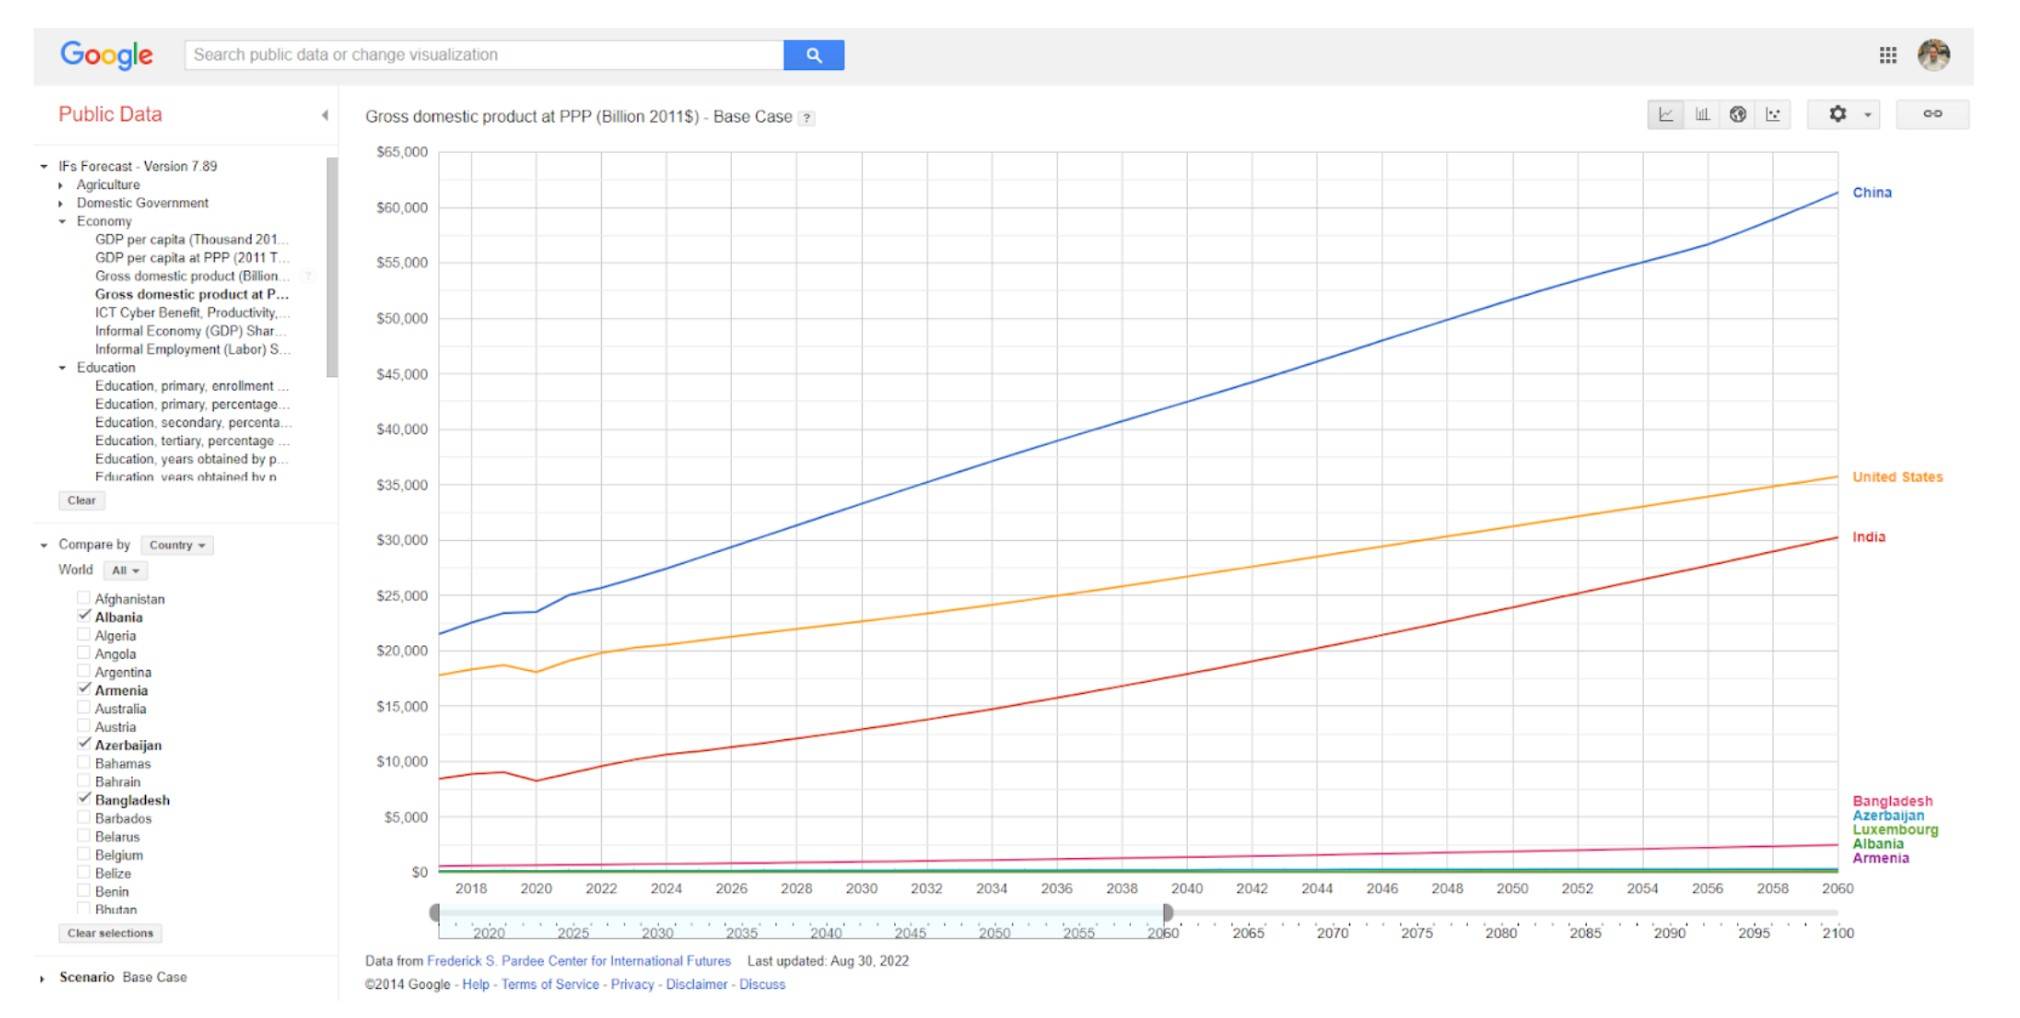
Source: Google Public Data Sets
The Google Public Data Sets launched back in 2018 to provide a search engine strictly for data. Keep this in mind and if there’s something specific that you are looking for, you’ll likely have the ability within this dataset to drill down and find it. It’s also very intuitive, with an easy to use interface, clear description of the data, and even a summary in some sections, so you’ll know if you have an angle on your data or not.
If you know the type of data you are looking for then this is a valuable resource to pull that data together before adding it into your Digital PR strategy.
Data.gov.uk
Data.gov.uk is one of the UK’s largest sources of open data, which has been published by either local authorities, public bodies or the central government. Topics that you can find data on include
- Business And Economy
- Government
- Transport
- Defence
- Crime And Justice
- Health and Education
The information available is very in-depth and can offer good granularity into a sector. For example, if we look at the travel sector we can find over 824 relevant publications, including GB Road Traffic Counts, GM Accessibility Levels, Transport Statistics by region, Metrolink data, Speed Camera data and more. With new publications being added every few days, or even multiple times a day, this information archive is kept well up to date with the latest information.
The database is quite user friendly and allows you to search by publisher, topic or format, as well as allowing you to sort by the most recent or most relevant topic. You can also do a general search if there is a specific data set that you are looking for. The data sets provided are extensive and, in addition to a standard summary, include a mixture of csv, pdf and zip files containing further information for your data analysis.
If you are looking to undertake a data analysis piece specific to one of the general topics listed above then this is a good data hub and place to start your research. The depth of the data lends itself well to regional analysis if you are looking to expand the reach of your content.
Eurostat
If you’re working with European clients then Eurostat will be one of your go-to data platforms. An official website of the European Union, this website is home to wide ranging data about the EU, including inflation rates, GDP growth, house prices, unemployment rates, population data and much more.
The website offers a vast amount of reports and data visualisations that are handy for data analysis. This covers everything from key facts broken down at country level, through to key figures that cover Europe as a whole. Eurostat also has an API section which lets you draw data directly from the source. This is invaluable when you are working with large datasets and can allow you to use a more enterprise approach to data analysis.
There are interactive dashboards where you can create your own datasets to analyse specific country’s data against the EU and Euro area as a whole. The below example shows where you can interactively check the information you are interested in and the information you are looking to compare together in a dashboard. This allows you to see the country data side by side and can lend itself quite well to effective data analysis.
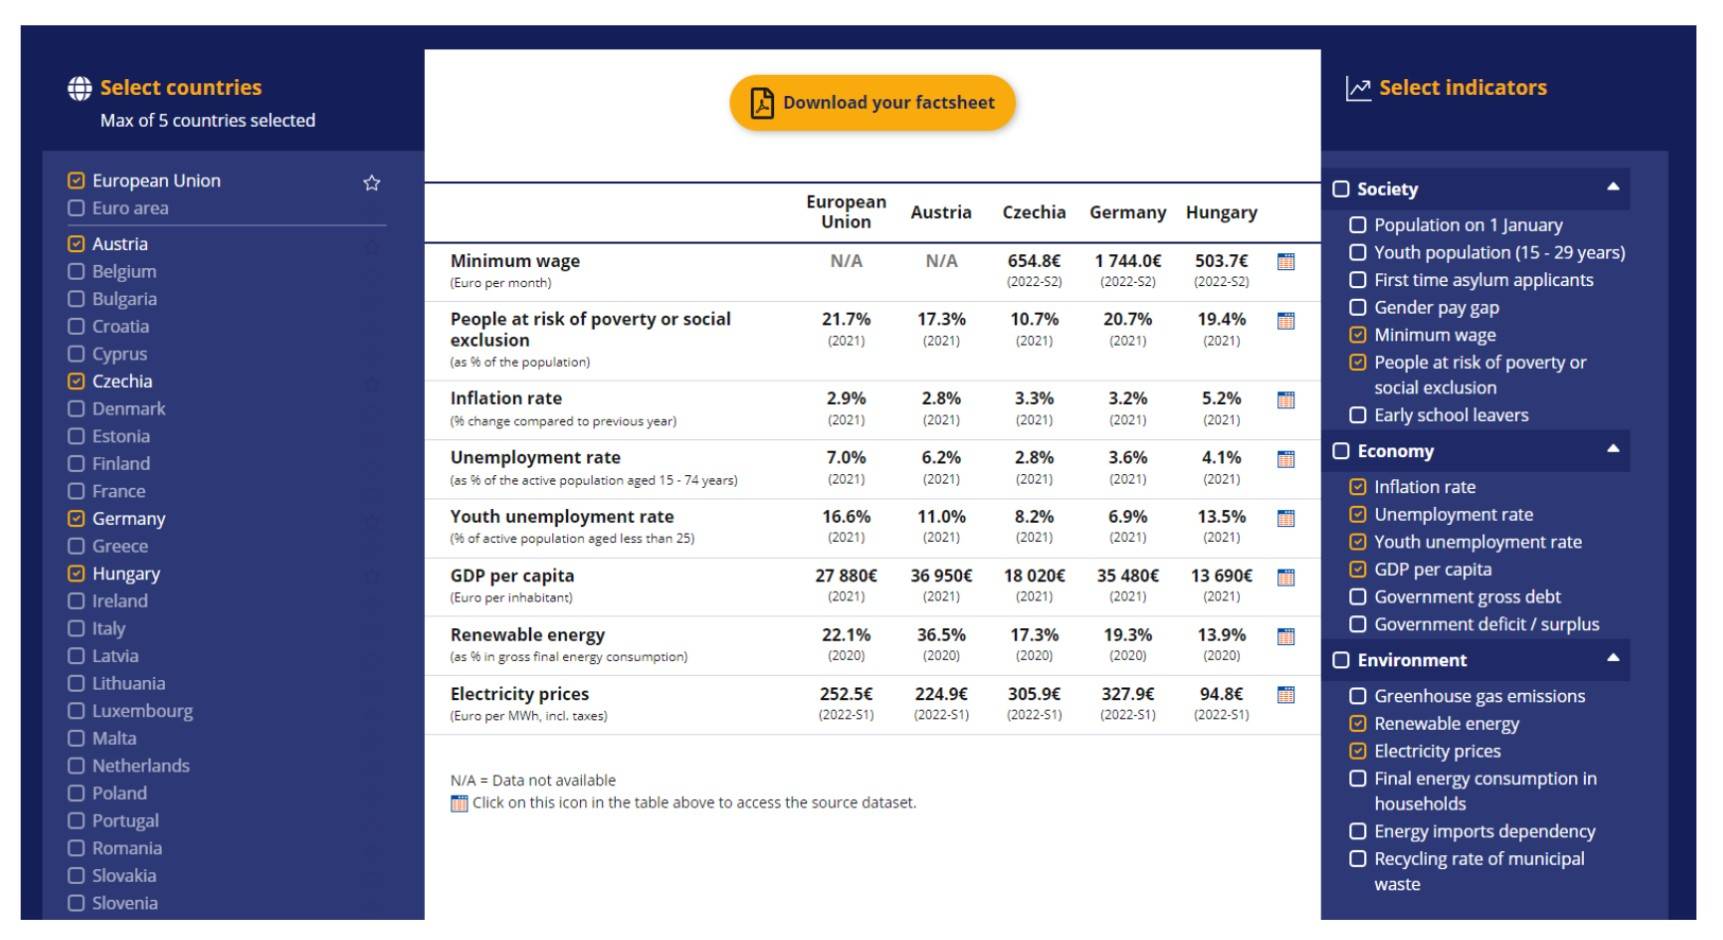
Source: Eurostat
Similar to many other data sources, Eurostat has a release calendar which you can use effectively for proactive newsjacking. It comes in a really easily digestible and aesthetically pleasing format:
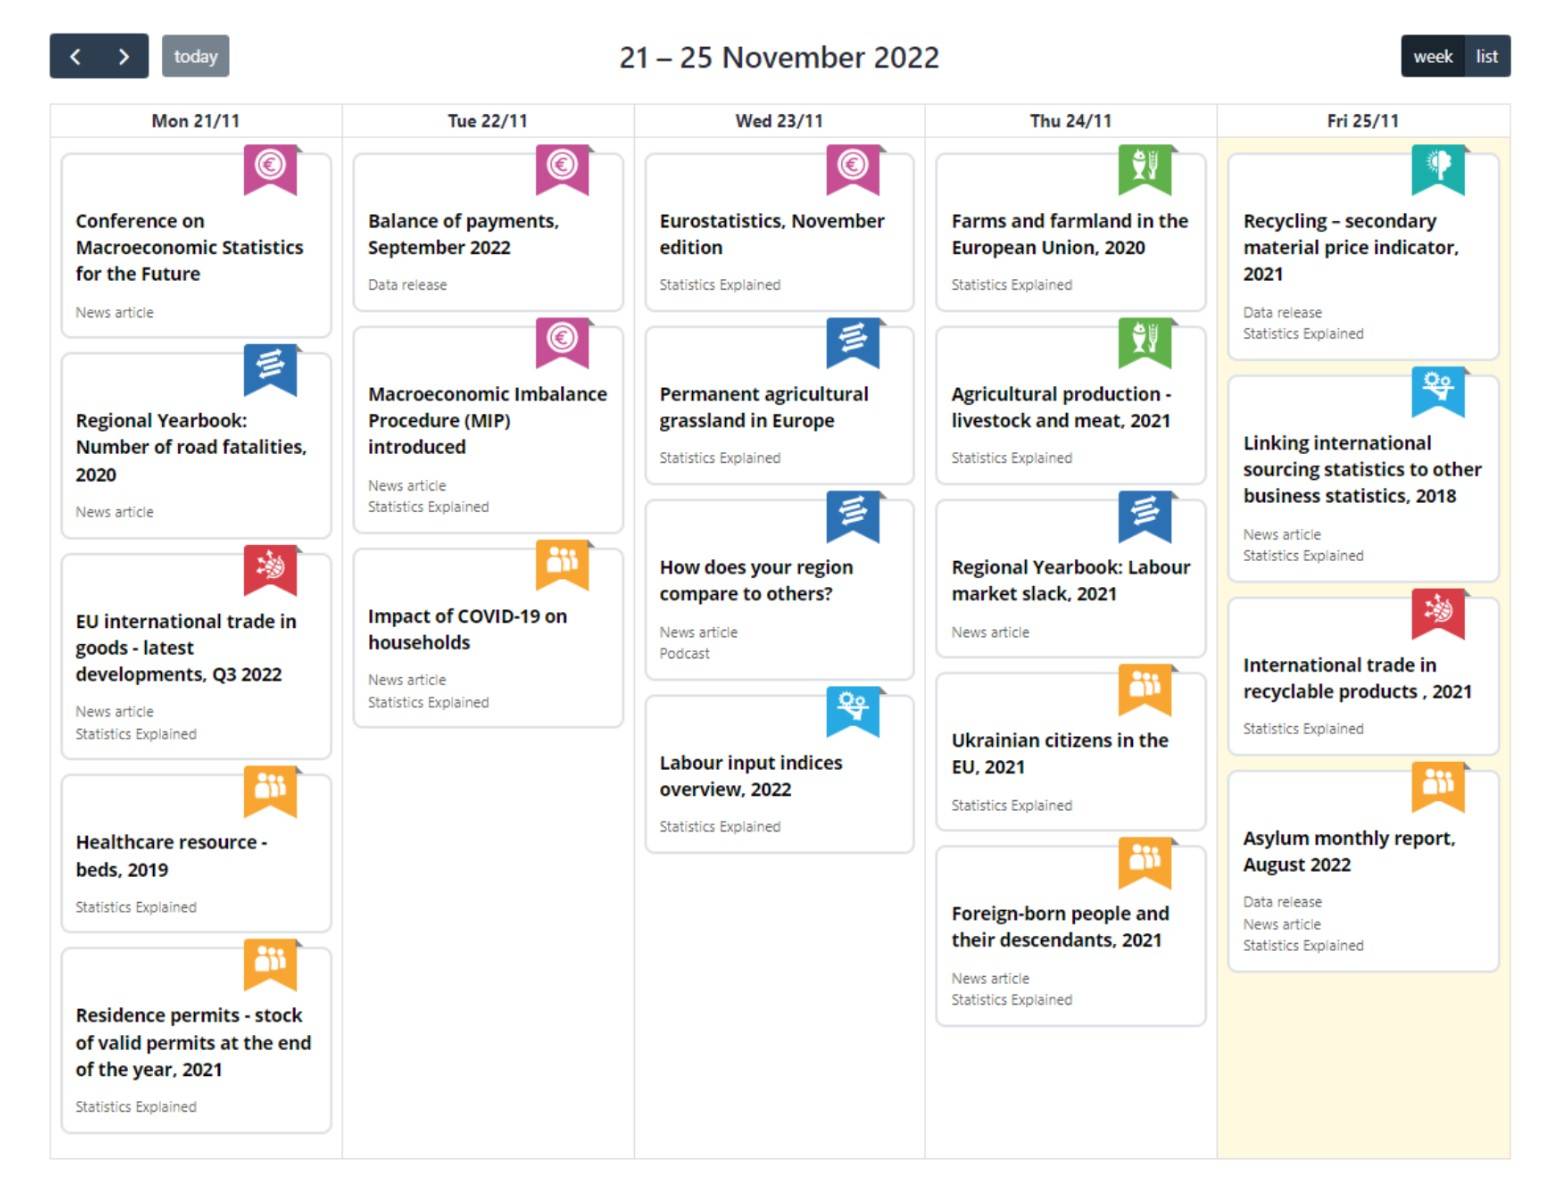
Source: Eurostat
If you want to create stories that involve data from the EU this is an excellent source of information and a great place to start. You can also use the handy calendar function to plan your campaigns in advance when you know key data is being released.
US Bureau Of Data Statistics
https://www.usa.gov/statistics
The US Bureau Of Data Statistics is home to a range of data information sources about the US. It includes census data and information about the economy, demographics and population. It’s a central hub for all information relating to the US and is an official website of the United States government.
In addition to publishing relevant data, the US Bureau Of Data Statistics also provides a list of useful links to other Federal Government data, including the Bureau of Justice Statistics, Bureau of Economic Analysis and the Bureau of Transportation. This allows you to visit the respective sections if you are looking for more granular information about a specific sector.
There are links through to sections for specific states and local governments too. So if you are looking to analyse data specific to a certain state or local area then utilising the websites provided here is a valuable place to start.
The website also has a maps section, covering topics such as environment data and water resources, current weather, recreation and agricultural information by commodity. If you are planning to analyse any of these in more detail, the website can give you information as granular as crop and plant yield and livestock/animal information.
If you’re working on some US Digital PR campaigns, then the US Bureau Of Data Statistics can provide you with the data and insight you need for those juicy data-led campaigns.
Now that you have your free data sources you are well on your way to creating some high quality, data-driven Digital PR content. So, what are you waiting for? Start jumping on those trends, analysing great data and producing juicy angles to get your coverage front and centre in the press, delivering those all valuable links back to your client’s (or your own!) website.
Want to find out more about how you can use free data-led sources for your Digital PR campaigns? Get in touch with our Digital PR team today!