If you’ve landed on this blog, chances are that you have heard all about Digital PR. It’s been an industry buzzword for a few years now & has really taken off in this time; even though many agencies, including ourselves, have been doing this for over 5 years!
Digital PR has been used in conjunction with SEO to help grow visibility for websites in a very holistic manner. While these two elements were previously siloed amongst marketing campaigns, more recently, agencies have started combining the two to provided added, targeted benefits for both their SEO and Digital PR campaigns. By combining the two elements, you are able to use the data-research side of SEO with the creative PR side of Digital PR to drive consistent campaigns. This not only drives high quality links into your website and grows brand awareness, but also supports growth in your overall SEO rankings and, therefore, traffic to your website and subsequent sales/conversions.
So What Is Digital PR?
Digital PR is essentially a strategy or plan which takes the principles of traditional PR & applies it in an online environment to online content & placements. Think of it as promoting a product or service but in the digital space and with the added incentive of creating high quality, relevant links for SEO. In turn, you also get the added bonus of the optimisation that comes with that.
Digital PR has been around for as long as PR has, but has only really come to the forefront in recent years. This is mainly due to the value that it can add to SEO campaigns and the real world returns that PR of this style can generate. PR has never been more measurable from an ROI perspective as it is in Digital PR format. This makes it an appealing option for businesses who are looking to grow sales/leads in addition to just growing standard visibility.
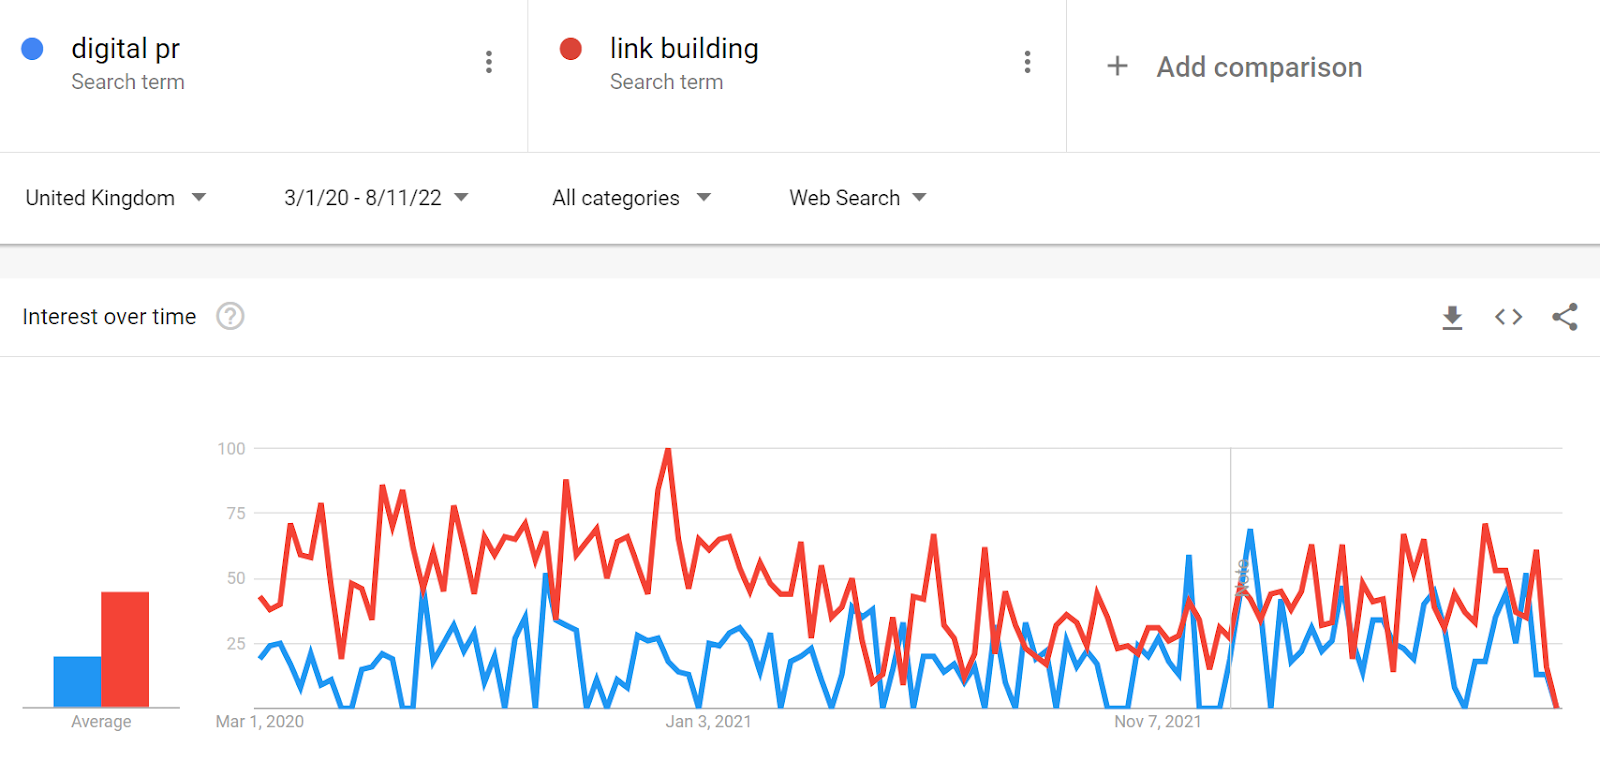
When we look over time we can see that “link building” in its raw format has always been a popular option for companies looking to improve their “website authority” or “Domain Rank” for SEO. In the last few years, however, we can see that Digital PR has started to meet link building as an equal. This has mainly been due to the rise in popularity of the term as a buzzword, but also the approach being seen as a more effective, sustainable and achievable method of link acquisition.
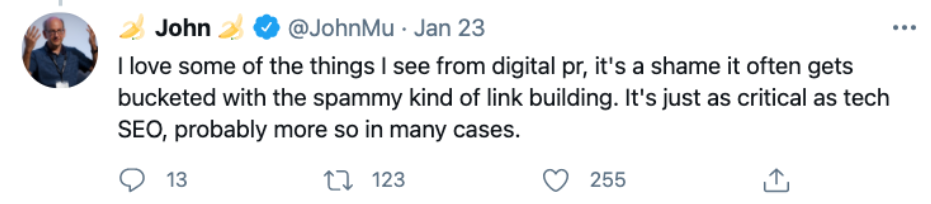
We’ve even seen John Mueller, Google Webmaster Trends Analyst, weigh in on it through his Twitter account, offering his view that he loves some of the things that he sees from Digital PR: “It’s just as critical as tech SEO, probably more so in many cases.” Who are we to argue?!
Although we’ve compared Digital PR and Link Building together above to review trends over time, it’s important to note that the two can be very different. Digital PR is a more holistic offering. It’s designed to not only improve SEO value and drive leads to your website, but also to enhance your visibility and start to create buzz around your brand, just as traditional PR does.
What Are Some Common Digital PR Techniques?
Digital PR, like any element of digital marketing, is done in a number of different ways depending on the agency that you work with and the results that you are looking to achieve. For example, Digital PR for an ecommerce company looking to drive sales of a specific product would look very different to a company looking to launch a new product, or a company who is looking to improve their overall awareness and traffic within a specific niche.
That said, there are a couple of techniques that can work across a number of different situations, they just need to be applied in different ways. Some of the most common Digital PR techniques that we use here at Cedarwood include:
Newsjacking
Newsjacking isn’t a new concept to PRs; it’s essentially the process of finding a newsworthy topic and putting your client at the front of the conversation. As Digital PR has continued to grow, so has the popularity of both Proactive and Reactive Newsjacking as a way of landing great quality coverage for a client while also showcasing that client’s expertise.
There are generally two different types of newsjacking: proactive and reactive. Both work in a slightly different way. Traditionally, proactive newsjacking would involve researching events in advance such as the launch of a new product, event or movie, or the launch of a new report, perhaps from NHS Digital or the ONS or a particular themed day or month coming up. This gives time to plan, gain the right comments and angle, and outreach in time to land coverage for clients.
Reactive newsjacking, on the other hand, involves monitoring the media to identify opportunities where we can potentially jump in with expert commentary or advice. To be reactive you need to have a great media monitoring set up and you need to be able to get into the conversation quickly with a fresh angle. You also need to have a quick turnaround on comments. We often recommend speaking to clients or your internal PR team in advance to prep them where tight turnaround might be required. Ideally, try to develop a process for this early on so you don’t miss out on key opportunities. For media monitoring, there are a lot of tools out there but some of the most popular are social media platforms, such as Twitter and TikTok, BBC Breaking News, Hashtags and daily newspapers.
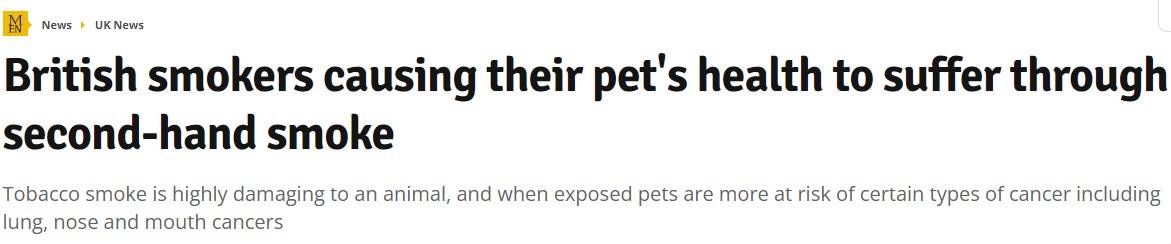
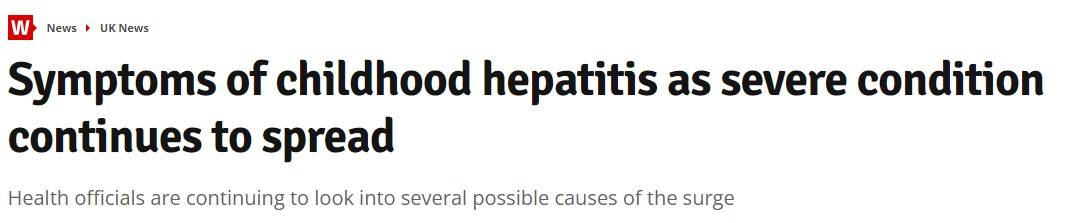
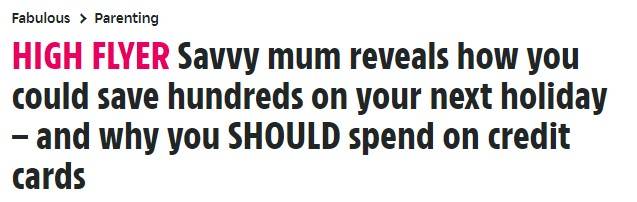
Newsjacking is a very popular Digital PR approach here at Cedarwood as it not only generates high quality expertise-driven links it’s also fast-paced and often fun. We love to get stuck in putting our clients in the centre of the conversation. Over the years we have created some fun newsjacking campaigns, from talking about how plants would handle lockdown ending to recreating Harry & Meghan’s Oprah garden scene. As well as tackling more serious topics such as highlighting the signs and symptoms of Cervical Cancer for Cervical Cancer Awareness Month.
Done effectively, Newsjacking is a quick and effective way to gain your clients coverage and to gain those all-valuable links back to the website.
Data-Led Campaigns
At Cedarwood we’re a fan of always-on link acquisition, in fact in one slide we could summarise our approach to Digital PR as follows:
That’s where data-led campaigns come in. Small, frequent data-driven campaigns are a great way to land links, highlight your client’s expertise and create a stable environment of always-on Digital PR. The days of high risk, high reward campaigns are often behind us, as we find journalists increasingly inundated with the larger style of campaigns. They now seem to prefer a smaller, more expertise-driven approach to Digital PR through data.
The great news when it comes to data-led campaigns is that there’s a tonne of free resources out there that you can utilise. In fact we’re currently pulling together a separate blog on all of the free data sources you can utilise, so watch this space. For now, we’ve listed some of the key ones below:NHS Digital
- ONS Data
- Instagram Hashtag Data
- Statista
- Freedom Of Information Requests
- Google Trends
- Google Ads Keyword Planner.
Once you have your data, undertake analysis to understand the angle. Remember a new, fresh angle backed up by expertise is your best friend when it comes to landing data-led campaigns. It’s therefore always good to have some ideas in mind prior to your data analysis, so you know what you are looking for.
If you aren’t able to gather the data freely then there are a number of paid for options, especially if you have something specific that you are looking for. Google Surveys and other survey providers can offer good options here. In many instances, it might be that you only need to ask just one question, in which case it can often be quite affordable too. Data-led campaigns don’t have to break the bank to be successful.
Here are a couple of examples of recent data-led campaigns that we’ve turned around quickly and outreached to gain some great placements and Digital PR for our clients.
Patient Claim Line: COVID-19 Survey
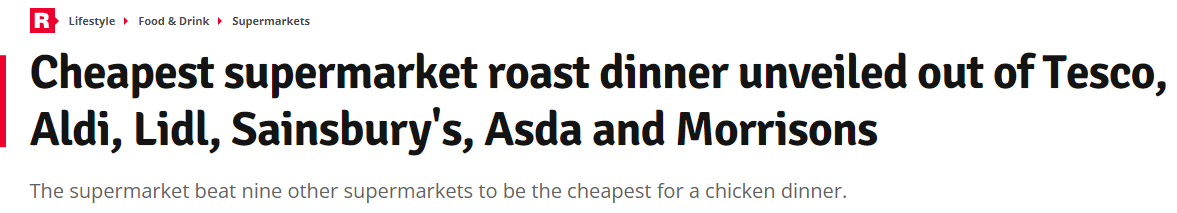
Cash Lady: Cheapest Roast Dinners
Thought Leadership
Thought Leadership is a great approach for modern Digital PR as it tends to combine a number of elements which are hugely beneficial for SEO – predominantly expertise and link acquisition all rolled into one!
Thought leadership is also a great way to extoll the virtues and expertise of your brand to a wider market, and really join the conversation on topics which matter to both you and your brand. Thought leadership is one of the elements that underpins a strong always-on Digital PR strategy and something that we love to do to build the expertise of our brands.
Speaking on his Twitter account John Mueller, Webmaster Trends Analyst at Google, speaks directly about how one very relevant link can be significantly more important than a whole chunk of links built into a website. It’s very much about quality over quantity. In many cases, Digital PR firms steer away from thought leadership as they see it as a lot of work for maybe just one or two links. Yet, in many cases, these one or two links can be more valuable than an entire creative campaign if they drive the relevancy and expertise that Google is looking for.
“Or there could be one really good link from one website out there that is, for us, a really important sign that we should treat this website as something that is relevant because it has that one link. I don’t know, maybe from like a big news site’s home page, for example. So the total number essentially is completely irrelevant.”
– John Mueller
So while many agencies and in-house teams are set on creating link goals or link targets based on the number of links achieved, to deliver real impact you need to focus on the relevancy and quality of individual links, rather than just trying to build links as a whole to the website.
Is Link Building Dead?
The way in which link building is done has come a long way in the last 10 years. Unfortunately, I still hear stories of agencies paying for links and more often than you would think. This is against Google’s guidelines. While it might work for a short period of time, after a while Google’s algorithm will catch this, and your website could be at risk of either a manual penalty or an algorithmic penalty from the Google Penguin update.
For those of you that are unfamiliar with Google Penguin or what it is, Google Penguin is an update designed to penalise websites that have undertaken dodgy link practices. There was a significant update many years ago now called Penguin 2.0 and it caught out a lot of Webmasters who had been purchasing links. For many of these it took years before they were able to get their websites back onto a good standing.
So link building is definitely not dead, but the industry as a whole is still seeing a lot of paid for link acquisition. It wouldn’t surprise me if there is a new variation of the Penguin update (which now runs in real time) to tackle this.
Digital PR is a great way to drive links into your website for link acquisition purposes, but it also helps to build on key E-A-T signals & drive relevance for your brand. Again, link acquisition definitely isn’t dead, but SEOs are having to adapt the way that they build links to really reach best practice.
Does Digital PR Actually Work?
Absolutely, hands down Digital PR is one of the most important elements of any SEO campaign. It’s also a great way to drive your overall brand relevancy and the visibility of your website. Digital PR is arguably one of the most important elements of any SEO campaign. It helps to build relevancy and expertise across your website, in addition to growing some great visibility for your clients.
Good Digital PR can help to build your traffic & visibility over time & correlates with SEO visibility & performance by helping to improve the overall authority within the website.
Below is an example of a client that we have done Digital PR for, for a number of years:

As you can see, the number of high quality links that we have created correlates closely with organic visibility & performance. When done well, Digital PR can have a direct impact on your SEO performance.
How Do I Find Relevant Topics?
Relevancy is an important element of any Digital PR campaign. Ensuring that your Digital PR campaigns match the relevancy and recency of your clients is very important to ensuring that you get the maximum impact from them.
One of the ways that we look to drive relevancy for our clients is by creating a mind map to really understand the core themes of our client. We can then build out content and topical resources around this.
Here’s an example of one that we did for a client in financial services. It shows how we are able to map everything to central themes to ensure that we keep relevancy at the heart of our campaigns.

It’s not just enough to find relevant topics though. You also have to find topics which are trending and topical, i.e. topics that journalists want to cover. There are a number of tools that you can use for this, from Google Trends through to BuzzSumo. These really help you to identify what is trending and, most importantly, anything that has already been covered to ensure that your content is topical and relevant.
How Can I Make Journalists Love My Content?
One of the main ways that we understand what journalists are looking for is through the concept of “Why Does The Reader Care?” At the end of the day journalists are looking for clicks on their articles, so we need to make sure our content is juicy, relevant and backed up by great data and a clear methodology. Get journalists to love your content by giving them what they want and giving it to them in a format that they can use without having to make too many changes. This can include:
- Attaching any imagery that they might require
- Clearly stating your methodology or linking to the methodology if required
- Ensuring that you have a clear bio of the company or person that has created the article
- Including any relevant links internally within the press release
- Making sure the press release has a clear hook for the journalist (and readers)
- Answering any questions that the journalist has previously asked.
Journalists are busy creatures so ensuring that you include all of the relevant information within your press releases is a great way to ensure that they’re best placed to cover your content. Additionally, make yourself available to them in case they have any quick questions. Don’t be afraid to jump on a quick call and point them in the right direction.
Journalists love content which gets clicks and which really engages the user, mainly human interest pieces. So when you’re creating your mind maps, stories or even brainstorming, creating ideas which have a strong human interest point is a great place to start. Always think about who might be reading the article and what they might want to know. Make sure that you have that great hook, a great angle and, most importantly, that you bring something new to the table.
Looking for more information on how to create a press release? Check out our guide to press releases which will help to point you in the right direction!
How Do I Measure Digital PR?
Measurement is essential to any effective performance marketing channel and Digital PR is no different. Being able to measure and justify the investment in this channel is key to growing clients and proving value and strong ROAS. So, how do we go about measuring how successful our Digital PR campaigns have been and what value this particular channel adds?
Measuring Digital PR can be done in a number of different ways with a range of different tools. Before you start measuring, take the time to work out what you are trying to achieve; it shouldn’t just be just a certain number of links. Think about the business goals and how you can map those down to online goals accordingly. I’ve always thought of it like this:
Business Goals – Online Goals – KPIs
By ensuring that you always have the business goals as the top marker, you know that you are delivering that all-important value and ROAS. Now that you have your business goals where do you start with measurement? Well this can be done in a number of different ways but I’ve listed the two most common metrics that we use below:
Link Scoring
We know that not all links are equal, so setting a simple link target wouldn’t quite cut the mustard when it comes to understanding the value we are delivering for a client. That’s why we use a concept of “Link Scoring” to understand how important and valuable our work can be.
Our link scoring matrix takes the type and relevancy of the link and combines it with key metrics such as Domain Authority and Rank to produce a “link score.” Each month we set a target based on this link score and tie it back to our KPIs. This ensures that any Digital PR work we undertake is focused on our client goals and keeps relevancy, expertise and value at the core at all times.
Visibility Metrics
Key visibility metrics, such as overall traffic value, help us tie our Digital PR service closely to website impact and SEO results. By looking at a metric like traffic value we can combine a keyword’s position with its estimated traffic level to understand how much valuable traffic we are bringing to the website.
By measuring in this way we are ensuring that higher rankings for keywords are actually bringing in traffic. We don’t want to fall into the trap of getting keywords to position one that bring no traffic or value for the client. By tying these metrics back to our Digital PR campaigns we can prove value and ROAS for our client’s investment.
Summary
Digital PR is a hugely effective tool and a big part of the modern digital marketing mix. With experts from Google singing its praises and highlighting how important it is within the marketing mix, we can be sure that effective Digital PR will play an important role in digital strategies for many years to come.
Want to find out more about how Digital PR can help your agency or business? Get in touch.